Outer Island Pier Water Quality (2017)
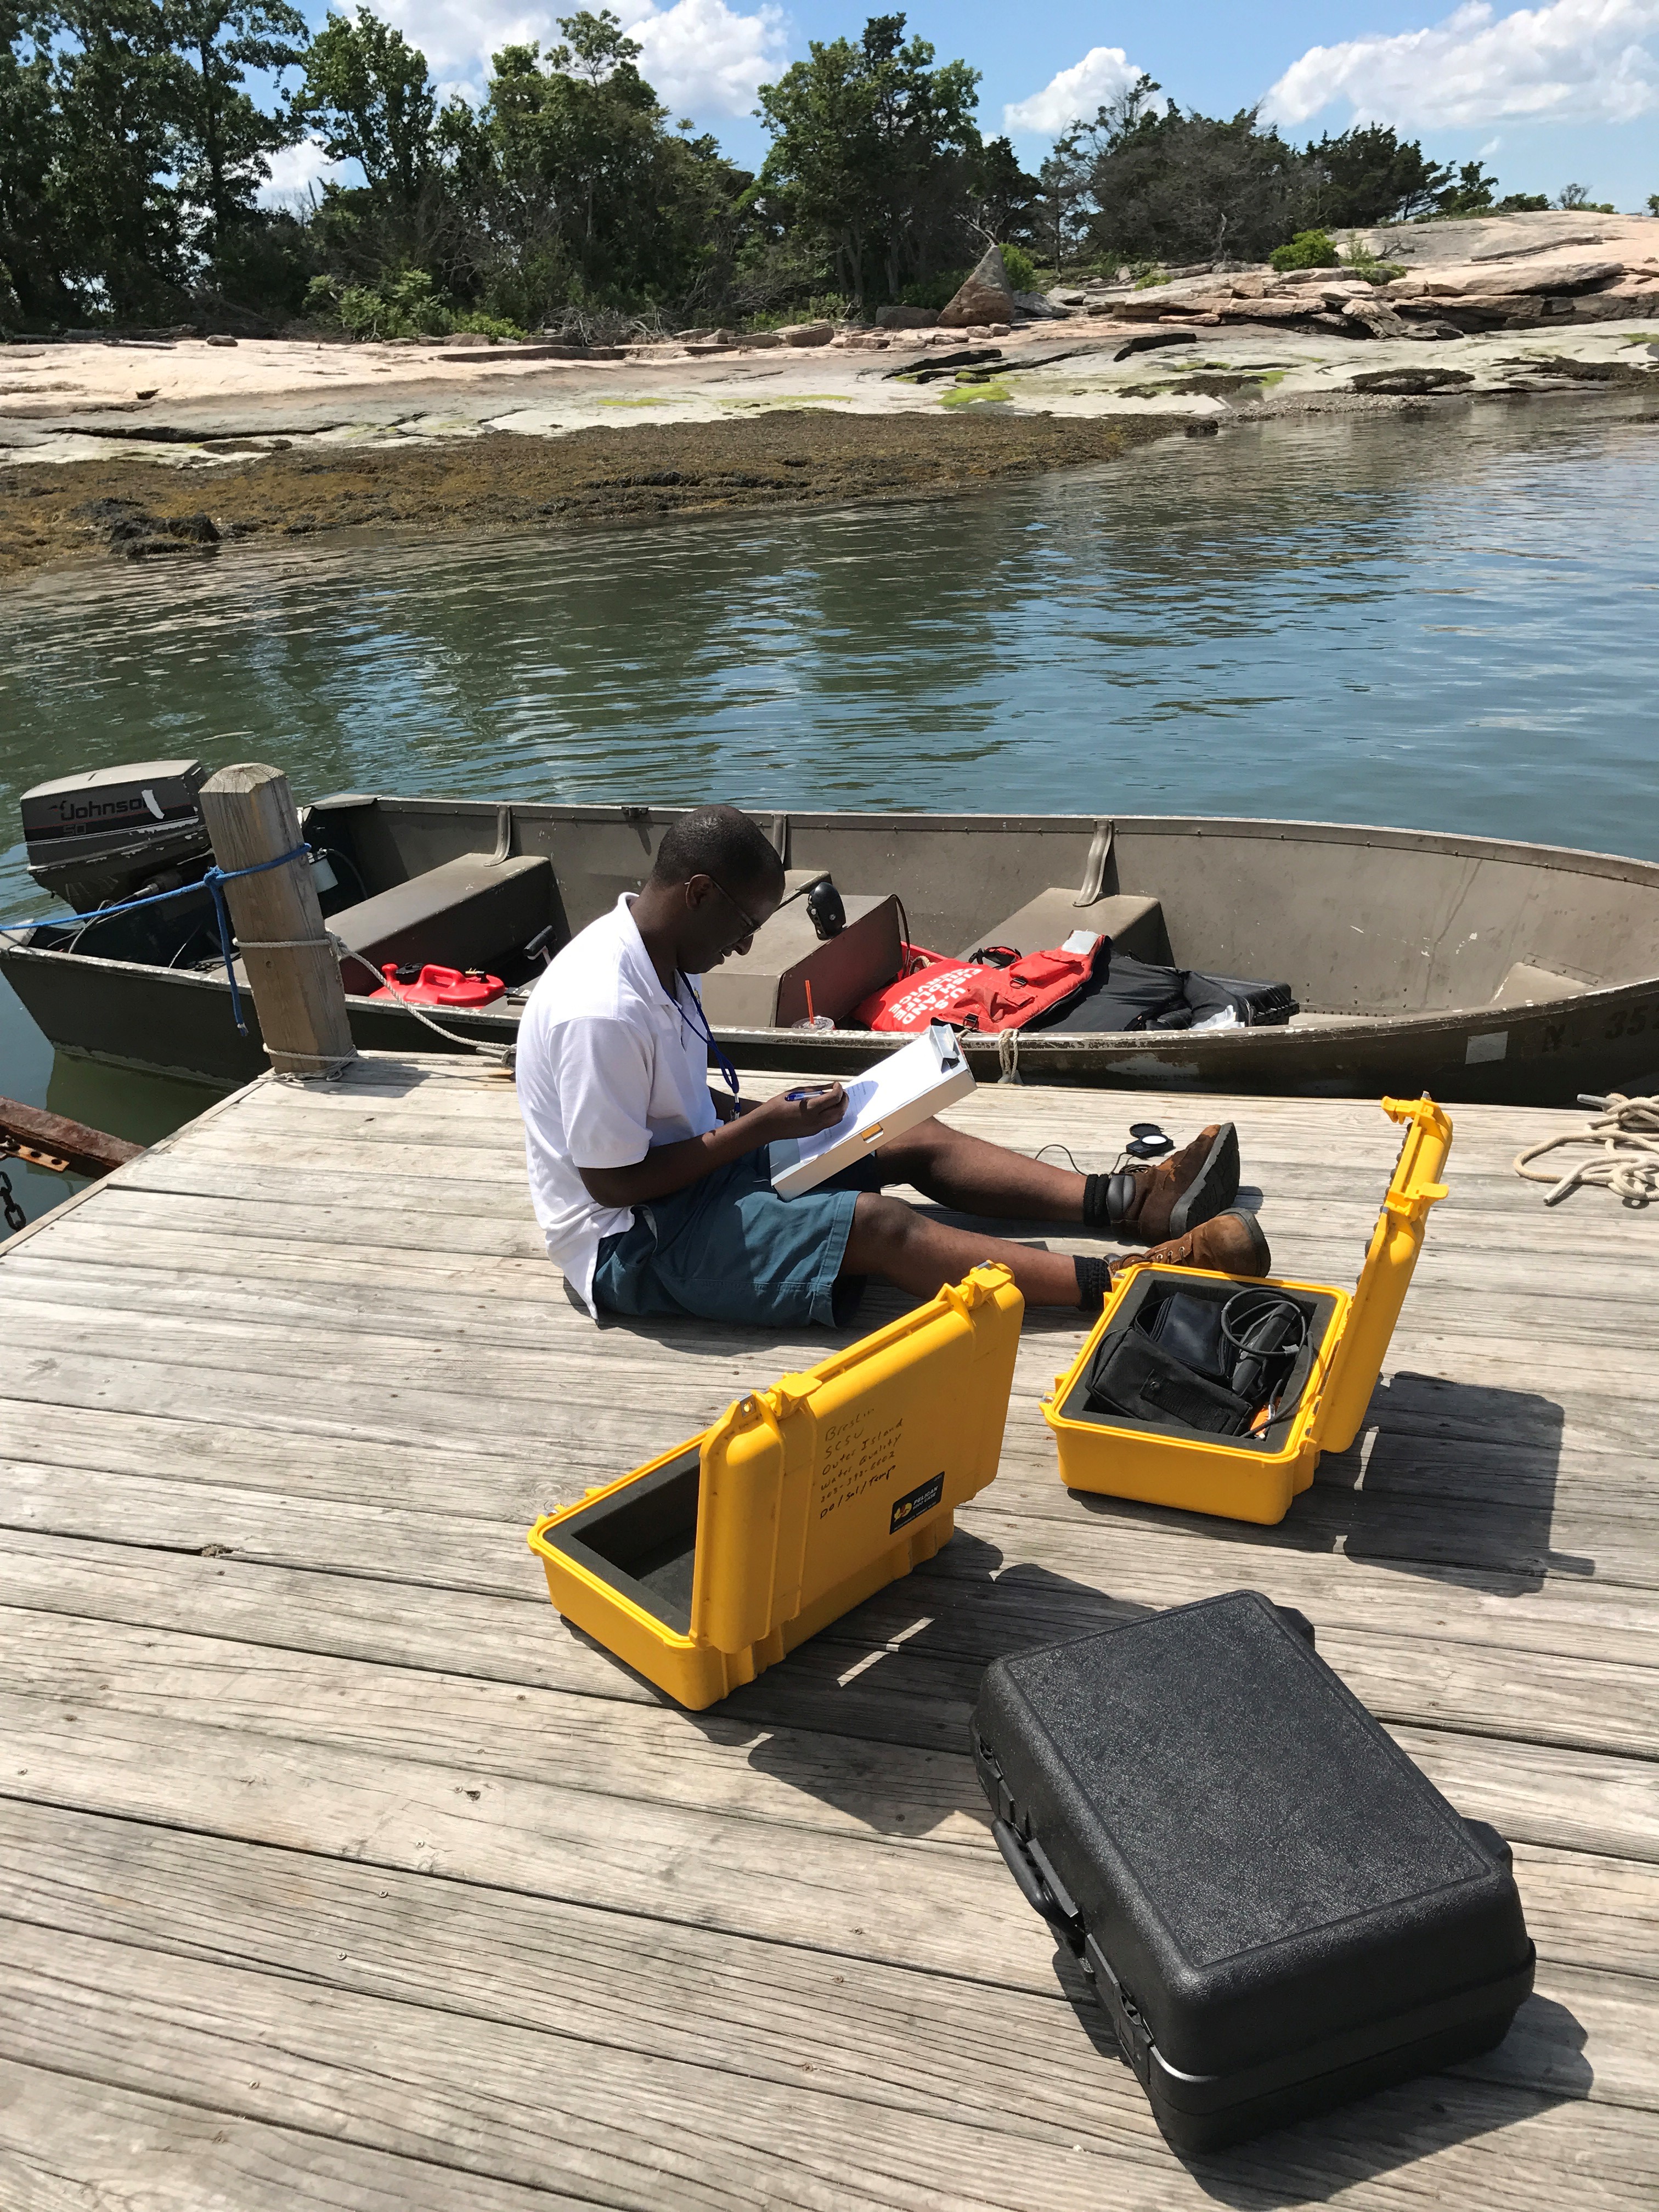
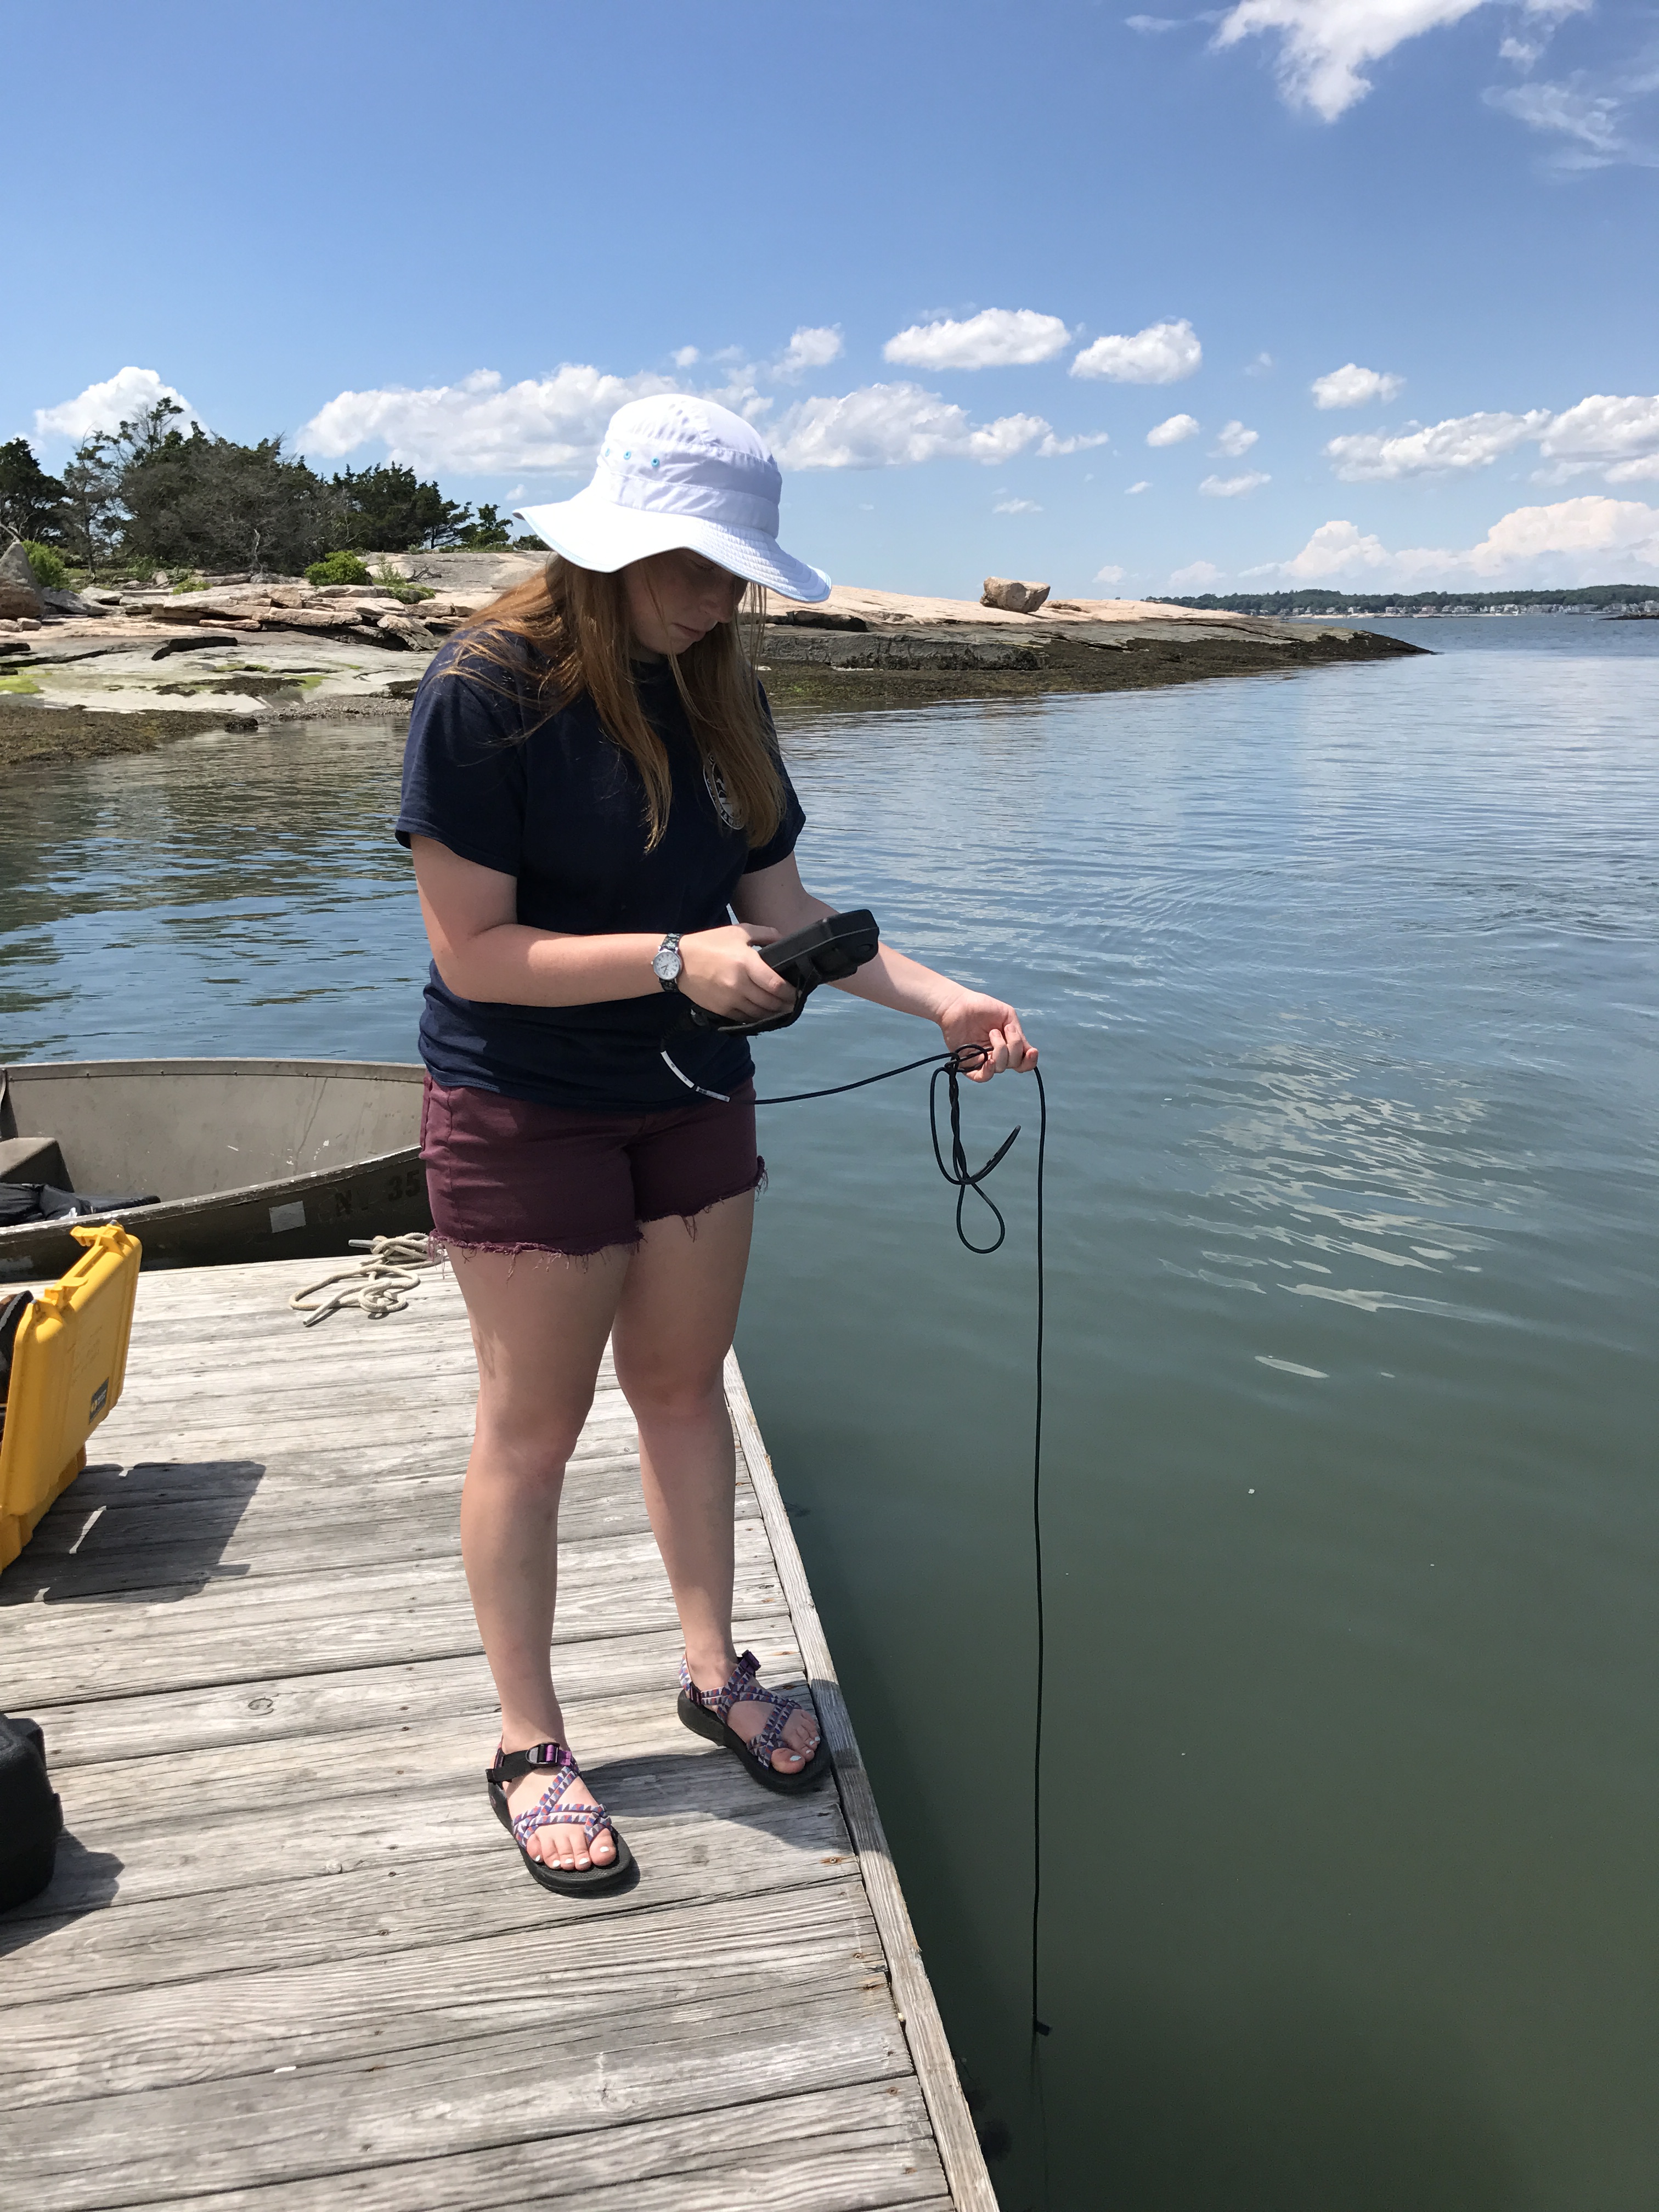
Water quality parameters were monitored by the CSU interns during the summer 2017 from June 1st to September 11th. Water quality monitoring occurred each day at 2:00 pm from the end of the floating dock. Water quality parameters monitored included: water temperature, salinity, conductivity, specific conductance, dissolved oxygen, Secchi disk depth, turbidity, and pH. All measurements were made on water samples collected from at a depth of one meter.
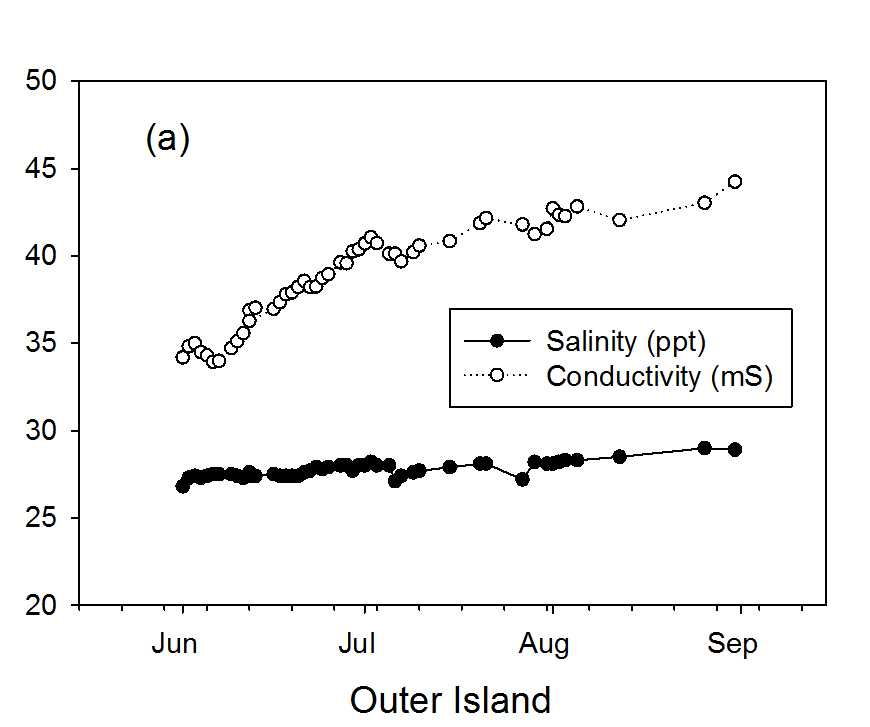
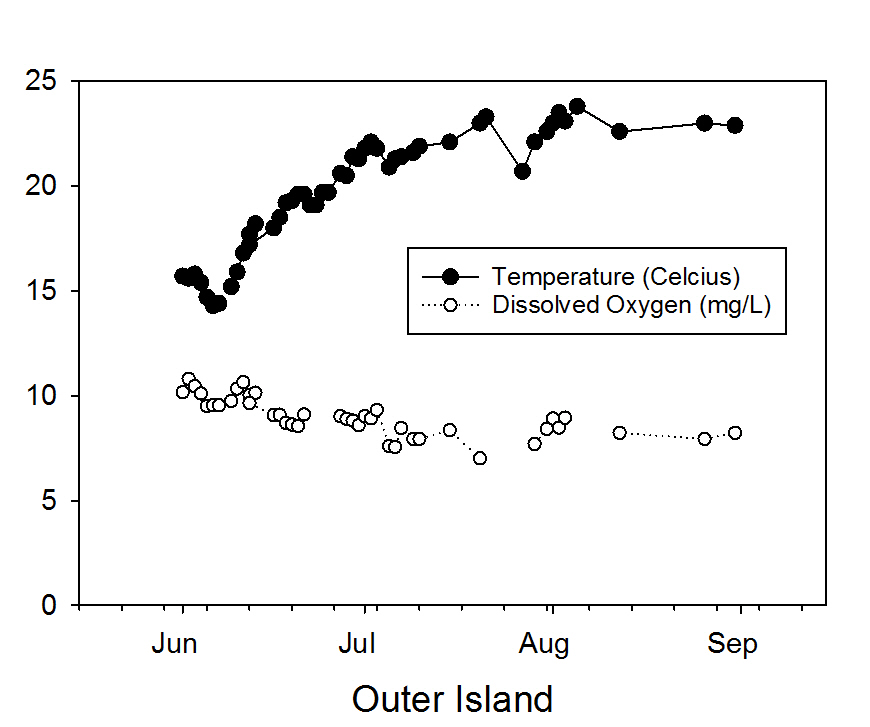
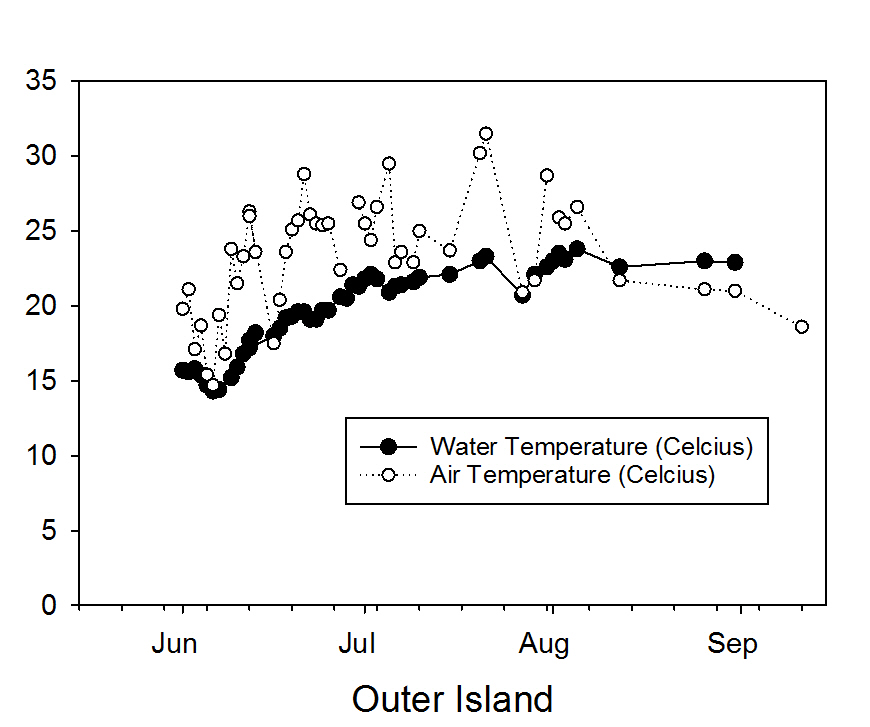
Water temperature gradually increased from the spring to the end of the summer. Water temperature ranged from 14.3°C (6/6) to a high of 23.8°C (8/5) (Figure 1b). Variations in water temperature over the summer correlated well with changes in measured air temperature (Figure 3). Dissolved oxygen concentrations saw an early spike (10.80 mg/L) on 6/2 and decreased slightly as water temperature increased with a low of 7.00 mg/L on 7/20 (Figure 1b). Salinity showed little variability, with a range of only 26.8 ppt (6/1) to 29.0 ppt (8/17), while conductivity showed a slightly larger range from 34.19 mS (6/1) to 44.25 mS (8/31) (Figure 1a). Both parameters showed less variability than in previous years.
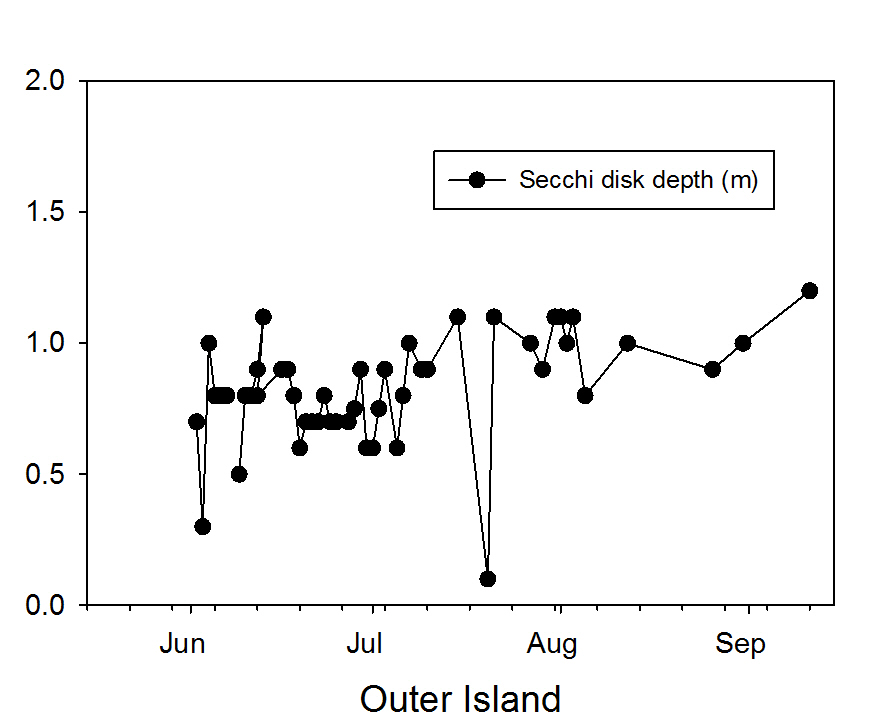
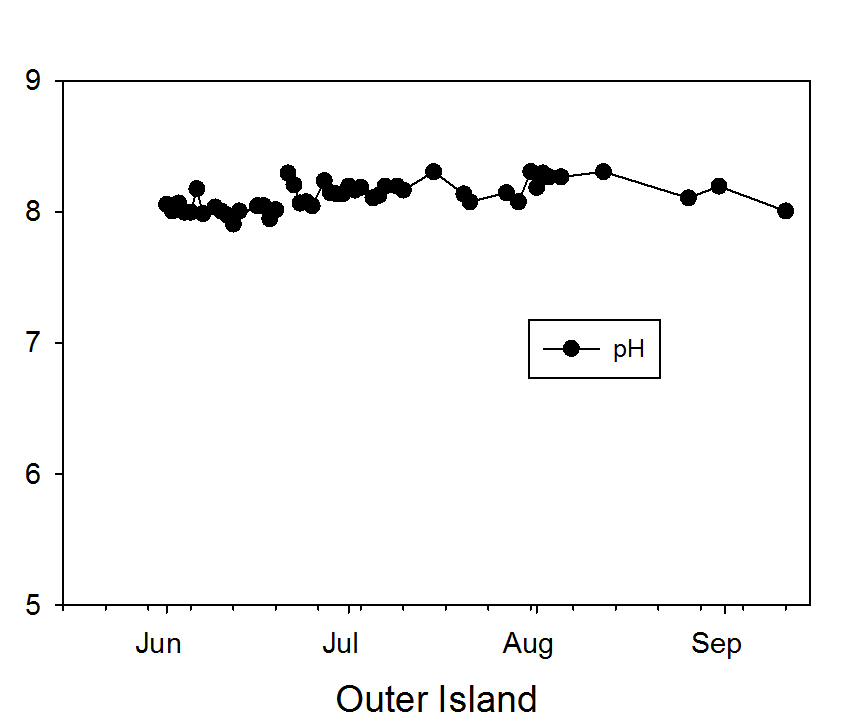
Water clarity, as measured by a Secchi disk, varied from 0.1 m (7/20) to 1.2 m (9/11) during the monitoring period (Figure 2a). pH ranged from a low of 7.91 (6/11) to a high of 8.31 (8/12) (Figure 2b). Similar to other parameters this season, water clarity/turbidity and pH showed less variation than previous years.
View/Download Data (Adobe PDF | Microsoft Excel)
2013| 2014| 2015| 2016| 2017| 2018| 2019 | 2020 | 2021 | 2022 | 2023 | 2024